Average Pharmacist Salary in 2019

What is the average pharmacist salary in 2019? In this blog post, I compiled pharmacist salary data from top salary sources.
Pharmacists consistently ranked among the most trusted health care professionals and also among the top earners. How much money do pharmacists actually make? I have researched this topic since 2011 and have a deep interest in it.
I know being a pharmacist is not all about how much money you make but hey it’s part of the equation! Although I have my own experience with my own salary, among pharmacists or with most professionals salary is kind of a taboo topic.
So I want to discuss a pharmacist’s salary. You can search for salary information on the internet but salary varies by a lot of factors such as region, titles, years of experience and industry.
Still, it is a good idea to where you’re at with your peers given everything else is the same. Glassdoor is a good place to start to get a personalized market value. BLS and other salary is also a good place to research pharmacist salary.
According to US News, pharmacists have a salary range of $110,310 to $142,710.
Pharmacists Salary According to Cities and Region
- Tyler, Texas $174,870
- Santa Cruz, California $155,330
- Vallejo, California $155,330
- Santa Maria $151,590
- San Jose, California $149,790
- Gadsden. Alabama $148,970
- Yuba City, California $148,620
- St. George, Utah $148,570
- Hattiesburg, MS $147,330
- Glens Falls, NY $146,900
National Pharmacists Salary Data from 2018 BLS Data
| Employment | Medium Hourly Wage | Median Annual Wage |
| 314,300 | $60.64 | $126,120 |
The job outlook from 2028-2028 is flat at 0%.
Employment change from 2018-2028 is -100. That’s not a typo. That’s negative 100!
Data last updated 9/4/2029.
For comparison purposes, we can look at salary data from Texas.
Texas Pharmacists Salary Data from 2018 BLS Data
| Employment | Medium Hourly Wage | Median Annual Wage |
| 21,250 | $60.96 | $126,800 |
Pharmacists nationwide are earning from $87,000 (lowest 10%) to $161,250 (90 percentile)

Pharmacists salary in addition to the geographical location can be broken down into major industries.

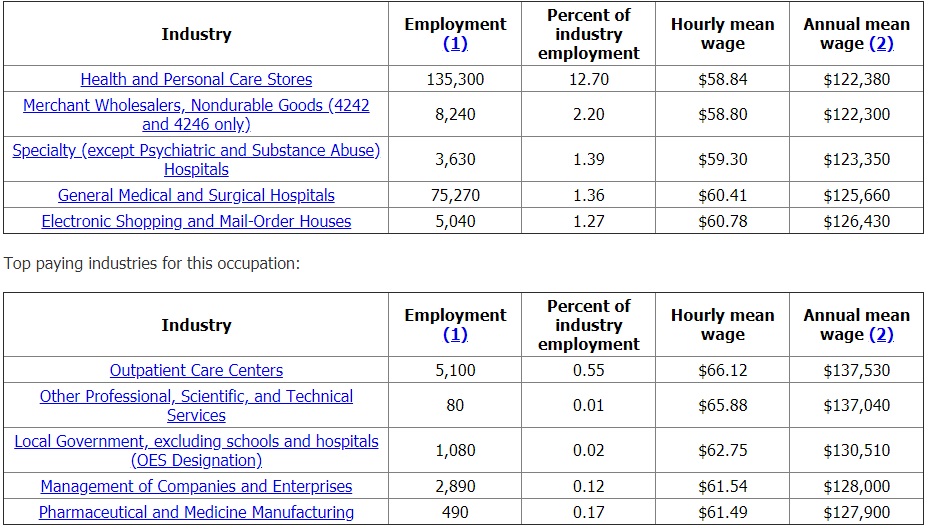
Pharmacists are employment are concentrated mostly the retail and hospital setting 135,300 and 75,270 respectively. Which pharmacists make more money? According to BLS, hospital pharmacists are making an average of $60.41 compared to $58.84 average hourly wages for retail pharmacists.
The highest paid pharmacists are working in the outpatient care centers setting. Of course, pharmacists in management such as pharmacy managers and director of pharmacy makes an average of $145,000 to greater than $161,000 yearly.
Median pharmacist pay in May 2018 by industry:
- General merchandise stores: $131,460.
- Food and beverage stores: $130,140.
- Hospital: $127,330.
- Pharmacies and drugstores: $124,760.
- Pharmacies and drugstores: $124,760.
Of note, although you can still get jobs at the hospital without a residency. Increasingly, it is getting harder to get a hospital job without a residency. Most clinical pharmacists opted to go for a general PGY1 or specialize in a PGY2 pharmacy residency to gain an edge in the job market.
Another source, salary.com, the average Pharmacist salary in the United States is $132,513 as of March 28, 2019, but the range typically falls between $124,861 and $141,134.
Yet another source, payscale.com has pharmacist making an average of
$112,152 with a typical range of $85,804 – $137,542.
A Zippia representative contacted me and suggested I add their pharmacist’s career path for your reference. I thought that their career path and pharmacy as a career is a good resource. Check it out here.
Lastly, glassdoor.com has the national average salary for a Pharmacist as $127,516 in the United States. Glassdoor offers a unique way to track salaries. Salaries are presented as averages based on users’ anonymous self-reporting categorized by job titles. As you can see the ranges and averages depending on your source varies widely. This is due to where you work, years of experience, residency, board certifications, and area of practice.
My Own Experience
I started out as a PRN pharmacist making $61 dollars an hour. When I got a full-time job my hourly wage changed to $60 an hour, an equivalent salary of $125, 040 yearly. In subsequent years, I received yearly raises of approximately $1.20 per hour. I am currently making $68 an hour as a pharmacy manager.
I don’t know what the standard starting salary is nowadays-but I know of a co-worker who makes $59 an hour as a staff pharmacist in 2018. From my experience, PRN pharmacist is getting a rate of $55 in my region. A clinical pharmacist I know started at $55 an hour and is now making $67 an hour after 7 years of experience.
Highest Average Salary by Pharmacy School Attended
Recently, I bumped into a really different kind of ranking from SoFi. This is Sofi’s report on pharmacy ranking based on the return of investment. The 2017 ranking is based on data from Sofi’s 19,000 refinance applicants. The rankings are based on average debt owed versus average income.
As a rule of thumb, pharmacists earn more income on the West Coast. Shout out to the University of California, San Francisco’s graduates for getting average earnings of more than $145,000 per year with an average student loan of $110,000.
If you’re going to for value then North Dakota State University won the crown. NDSU’s graduates earn a little over $121,000 per year but only carry a debt load of only $73,000!
On the other spectrum is the worst performer on the return of investment. Care to guess? You got it! Private pharmacy schools usually charge above average tuition and Pharm.D. graduates from these schools carry the most student loans. The worst of these is the University of Charleston. Pharmacy graduates from UC carry a debt of over $193,000 but are only earning the national average pharmacist pay of around $122,000.
10 States Where Pharmacists Earn The Most Money
- Alaska: $139,880
- California: $139,690
- Vermont: $135,420
- Maine: $133,050
- Wisconsin: $132,400
- Oregon: $130,480
- Minnesota: $129,080
- Missouri: $128,420
- Washington: $127,360
- New Hampshire: $127,350
10 States Where Pharmacists Earn The Least Money
- North Dakota: $103,250
- Montana: $112,290
- Oklahoma: $115,000
- West Virginia: $115,130
- Iowa: $116,160
- Pennsylvania: $116,200
- South Dakota: $116,410
- Ohio: $116,720
- Massachusetts: $116,890
- Indiana: $117,260
Average Pharmacist Salary in Every State
| State | 2018 Average Salary | 2017 Average Salary | 2016 Average Salary | 2015 Average Salary | 2014 Average Salary | 2013 Average Salary |
|---|---|---|---|---|---|---|
| Alabama | $122,200 | $122,020 | $120,340 | $121,550 | $122,010 | $119,020 |
| Alaska | $139,880 | $138,020 | $137,650 | $138,910 | $136,320 | $133,030 |
| Arizona | $125,210 | $124,970 | $119,450 | $119,600 | $119,280 | $121,020 |
| Arkansas | $118,320 | $117,670 | $116,960 | $115,960 | $113,730 | $109,470 |
| California | $139,690 | $136,730 | $136,100 | $135,750 | $132,160 | $129,560 |
| Colorado | $120,980 | $118,360 | $117,760 | $115,650 | $116,390 | $115,330 |
| Connecticut | $123,950 | $123,610 | $120,780 | $117,910 | $119,420 | $119,040 |
| Delaware | $125,400 | $122,230 | $117,560 | $115,230 | $113,920 | $118,000 |
| District of Columbia | $125,160 | $123,490 | $120,740 | $113,610 | $111,530 | $112,230 |
| Florida | $119,710 | $118,780 | $118,300 | $116,110 | $114,380 | $112,560 |
| Georgia | $118,710 | $117,690 | $116,170 | $116,780 | $117,220 | $115,000 |
| Hawaii | $121,780 | $117,680 | $114,880 | $115,520 | $116,590 | $116,130 |
| Idaho | $121,940 | $119,790 | $116,030 | $113,560 | $112,980 | $110,440 |
| Illinois | $125,360 | $120,280 | $117,140 | $115,990 | $116,290 | $116,430 |
| Indiana | $117,260 | $115,640 | $116,730 | $115,230 | $115,540 | $112,860 |
| Iowa | $116,160 | $112,390 | $110,240 | $104,620 | $100,750 | $102,350 |
| Kansas | $121,790 | $117,370 | $118,510 | $117,380 | $119,240 | $116,590 |
| Kentucky | $122,450 | $121,970 | $121,690 | $121,530 | $122,090 | $121,100 |
| Louisiana | $119,380 | $115,560 | $112,710 | $113,910 | $113,070 | $110,880 |
| Maine | $133,050 | $125,680 | $123,250 | $125,340 | $129,100 | $127,520 |
| Maryland | $121,210 | $118,920 | $120,400 | $119,770 | $120,230 | $114,450 |
| Massachusetts | $116,890 | $116,820 | $114,600 | $113,690 | $113,330 | $113,550 |
| Michigan | $117,680 | $115,160 | $114,830 | $113,230 | $112,760 | $108,030 |
| Minnesota | $129,080 | $126,840 | $122,900 | $122,140 | $121,880 | $122,000 |
| Mississippi | $124,120 | $122,080 | $121,450 | $120,300 | $120,520 | $117,810 |
| Missouri | $128,420 | $123,610 | $120,930 | $121,080 | $122,530 | $122,010 |
| Montana | $112,290 | $113,080 | $111,660 | $110,760 | $106,670 | $105,080 |
| Nebraska | $119,670 | $113,720 | $108,670 | $100,740 | $100,630 | $101,380 |
| Nevada | $124,430 | $126,330 | $123,430 | $119,950 | $119,850 | $116,660 |
| New Hampshire | $127,350 | $127,900 | $128,790 | $128,490 | $124,540 | $122,000 |
| New Jersey | $120,660 | $115,110 | $117,440 | $118,680 | $117,560 | $113,710 |
| New Mexico | $125,450 | $122,670 | $120,340 | $118,790 | $118,130 | $118,670 |
| New York | $121,030 | $120,440 | $118,530 | $117,590 | $118,900 | $118,170 |
| North Carolina | $123,370 | $122,810 | $121,490 | $122,870 | $123,050 | $120,570 |
| North Dakota | $103,250 | $114,780 | $113,250 | $112,110 | $113,660 | $111,090 |
| Ohio | $116,720 | $114,950 | $115,310 | $115,040 | $115,050 | $112,580 |
| Oklahoma | $115,000 | $114,190 | $120,890 | $117,800 | $113,570 | $107,710 |
| Oregon | $130,480 | $125,850 | $122,970 | $121,050 | $121,700 | $119,120 |
| Pennsylvania | $116,200 | $113,830 | $113,630 | $111,160 | $110,360 | $107,420 |
| Rhode Island | $120,890 | $115,320 | $111,530 | $116,290 | $109,900 | $106,420 |
| South Carolina | $122,900 | $123,270 | $122,690 | $120,410 | $116,400 | $116,300 |
| South Dakota | $116,410 | $115,370 | $112,090 | $109,450 | $108,360 | $109,090 |
| Tennessee | $124,310 | $119,720 | $119,970 | $118,310 | $118,670 | $116,720 |
| Texas | $126,800 | $126,460 | $123,700 | $120,480 | $118,870 | $116,790 |
| Utah | $117,570 | $111,110 | $112,760 | $114,830 | $117,990 | $112,940 |
| Vermont | $135,420 | $134,090 | $128,380 | $123,650 | $122,890 | $122,800 |
| Virginia | $123,920 | $125,360 | $119,050 | $117,970 | $118,360 | $117,280 |
| Washington | $127,360 | $125,890 | $123,620 | $121,270 | $119,430 | $117,240 |
| West Virginia | $115,130 | $118,150 | $118,410 | $121,090 | $116,010 | $116,450 |
| Wisconsin | $132,400 | $130,670 | $124,060 | $122,020 | $123,290 | $122,130 |
| Wyoming | $117,700 | $119,160 | $115,550 | $118,370 | $112,070 | $113,120 |
Source: BLS and Forbes

Pingback: Saving and investment strategy in 2019 - Pharmacist Money
Pingback: Saving and investment strategy in 2019 - Pharmacist Money
Pingback: Financial advice for the first year pharmacist - Pharmacist Money
Pingback: Top Pharmacy Schools in Texas 2019 - Pharmacist Money
Pingback: Millionaire Next Door Summary - Pharmacist Money Blog
Pingback: Backdoor Roth IRA - Pharmacist Money Blog
Pingback: 7 Types of Income Streams - Pharmacist Money Blog